Rebuilding an inspection platform with AI
Avitas started as a GE venture, later acquired by Baker Hughes, with a big goal: use drones, robotics, and AI to make industrial inspections safer and faster across oil & gas, power, and energy.
I was the solo designer for the first 1.5 years. The product had been built by engineers and product, and inspectors struggled to use it. I defined the high-level flows, aligned the team on goals, and shaped it into one consistent, scalable platform. Instead of spending long hours building custom demos for every customer, the team could now focus on one unified product that powered every demo too. Along the way, sales prospects grew 35%.
Problem: Fragmented workflow, inconsistent design, poor usability, lack of essential capabilities
Inspectors faced a frustrating workflow, repeatedly re-entering and searching asset data across Dashboard, Inspection, and Report features. The platform lacked essential tools like search, filtering, and contextual insights, resulting in a disjointed, inconsistent experience. For industries needing continuous monitoring, this made extracting insights and taking action inefficient.
Discovery
Stakeholder interviews
When I started, the six PMs weren’t really talking to each other. Each managed a different industry and set of customers, so everyone saw only their slice of the product. I interviewed them one by one to piece together the bigger picture: what the platform was for, who it was really serving, and how each feature connected to the others.
Using this feedback, I created a concept map that aligned business goals at the company level, defined target personas, and visualized how existing features and workflows were interconnected.
Customer interviews and site visit
During site visits, I spoke with subsea and land inspectors to understand their workflow, needs, and pain points. Here’s what I found:
Journey map
I turned what I learned into a journey map of the full inspection, from setting up an asset to the follow-up visit. For every need along the way, I checked it against the roadmap: already built, missing from the MVP, or beyond the short-term plan. Shared with customers and the team, the map became how we agreed on priorities and what to build next.
Explorations: Initial concepts
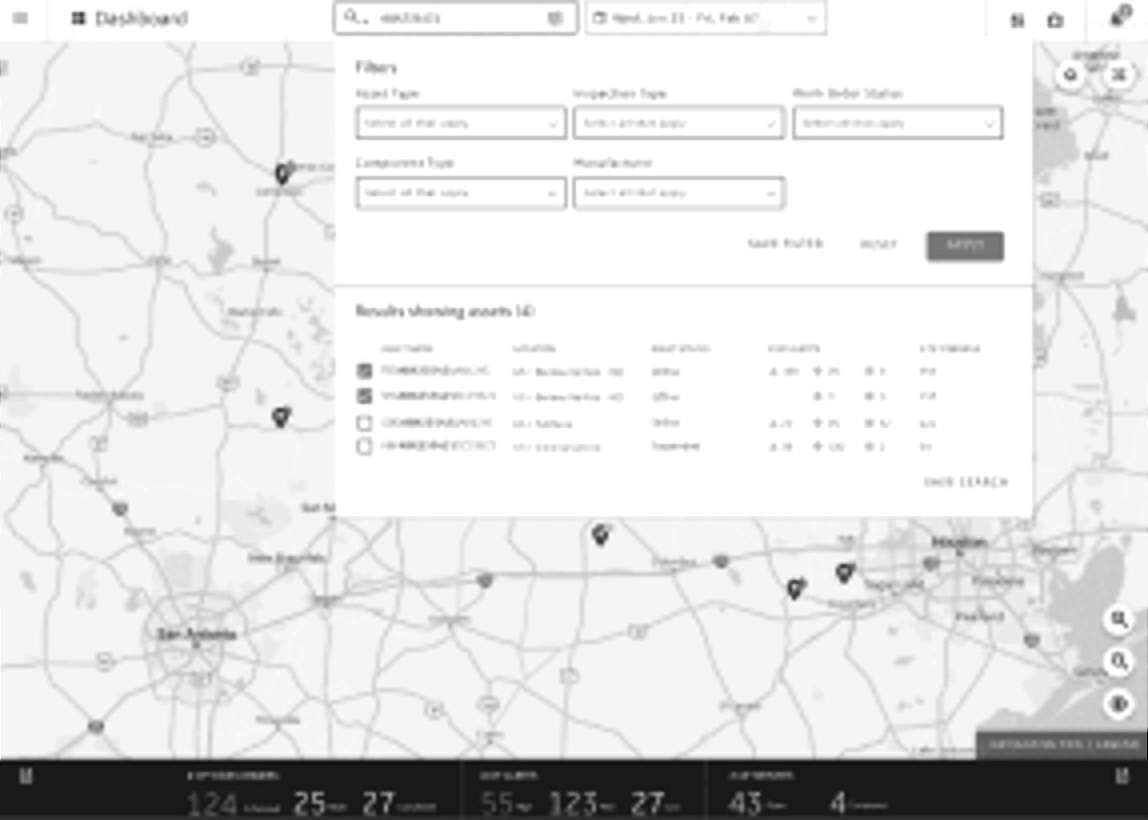
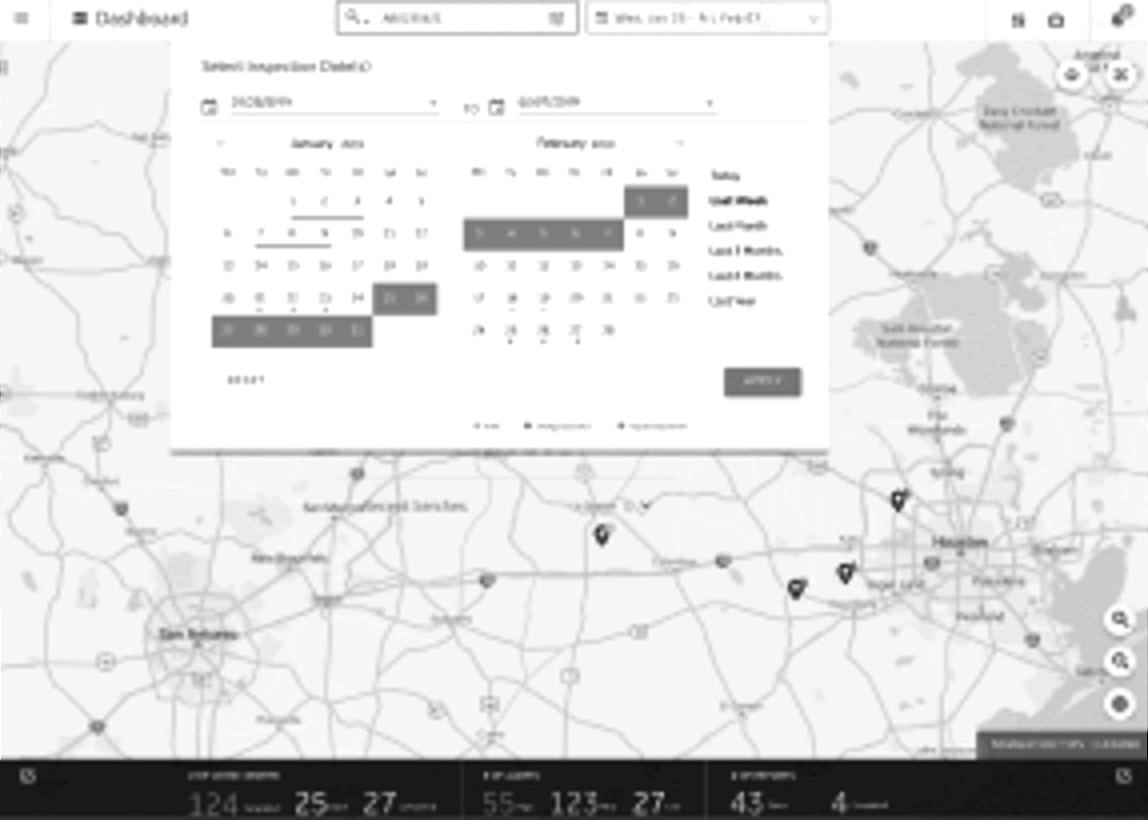
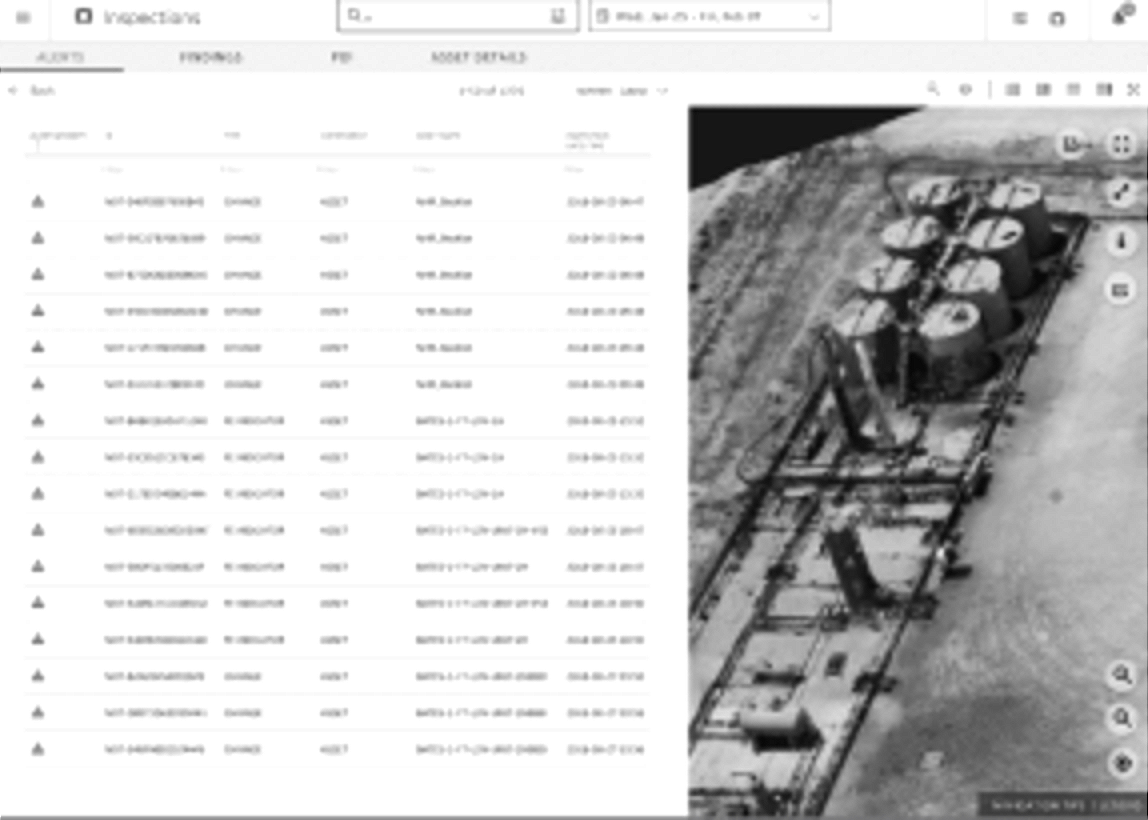
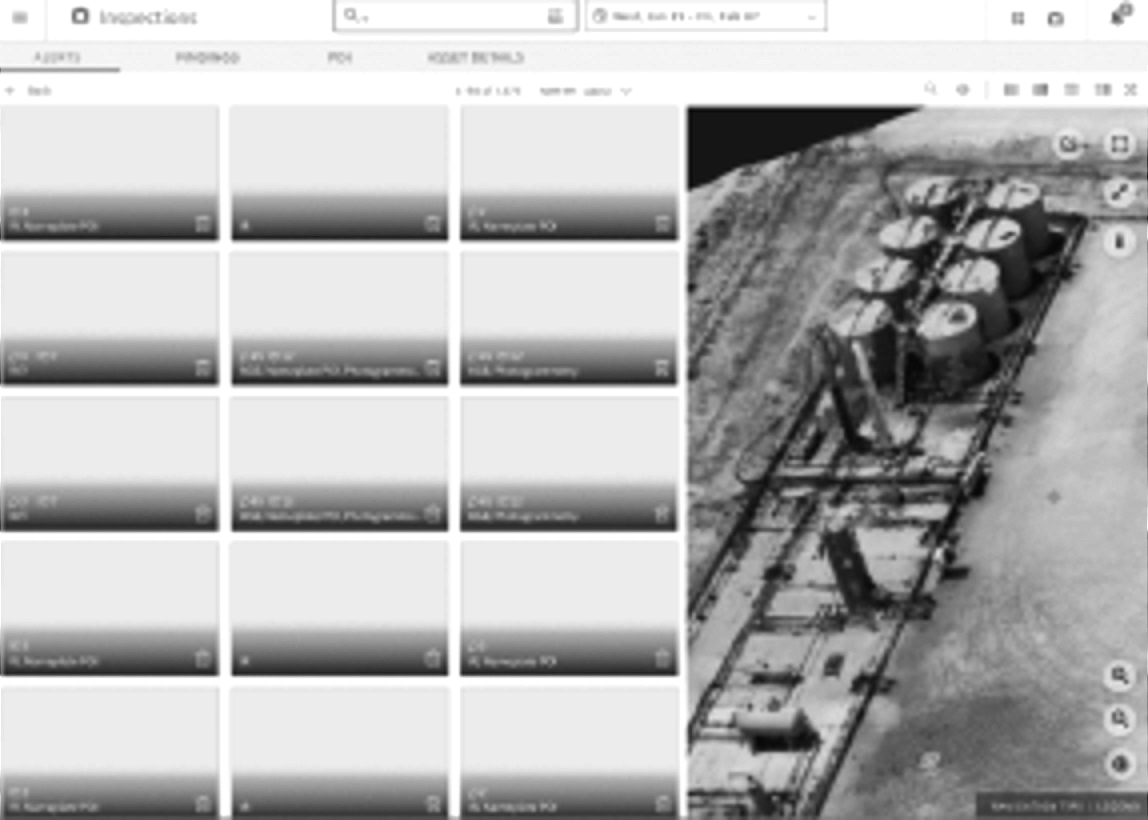
After the initial design exploration and workshop, my design colleague joined the team, and we worked together, splitting up features to refine and improve each key area.
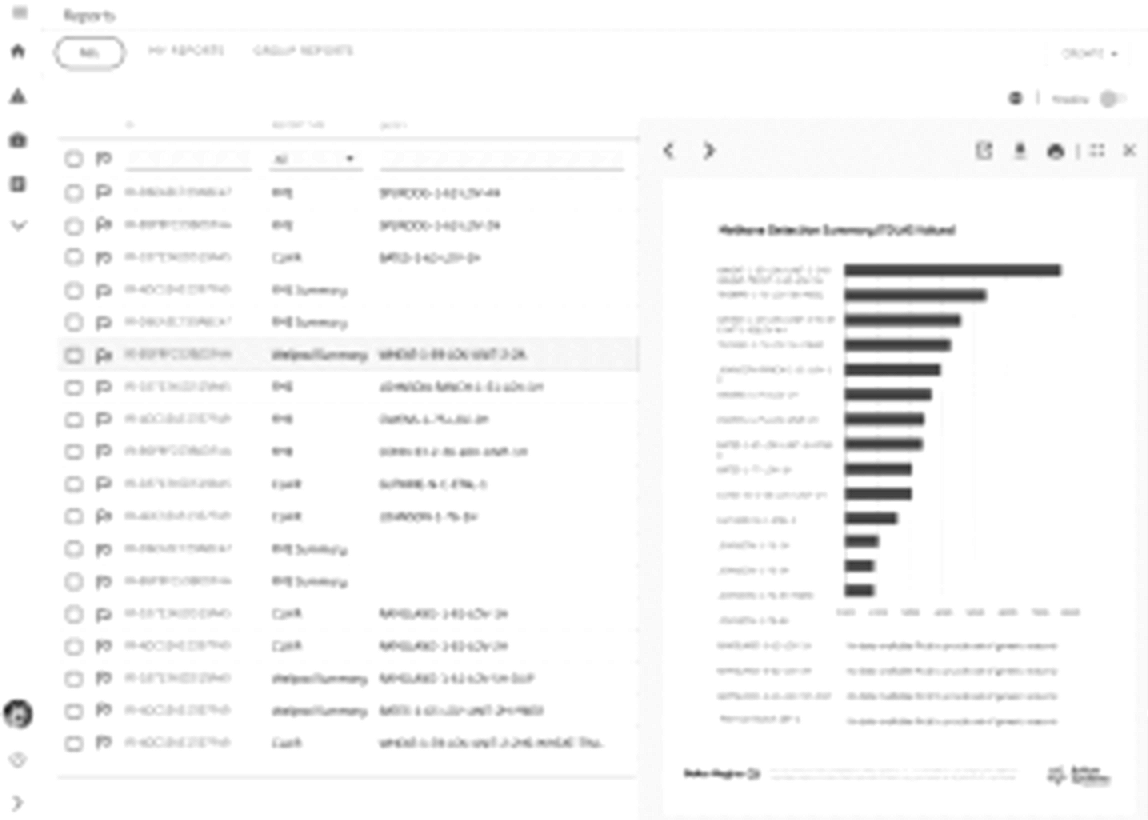
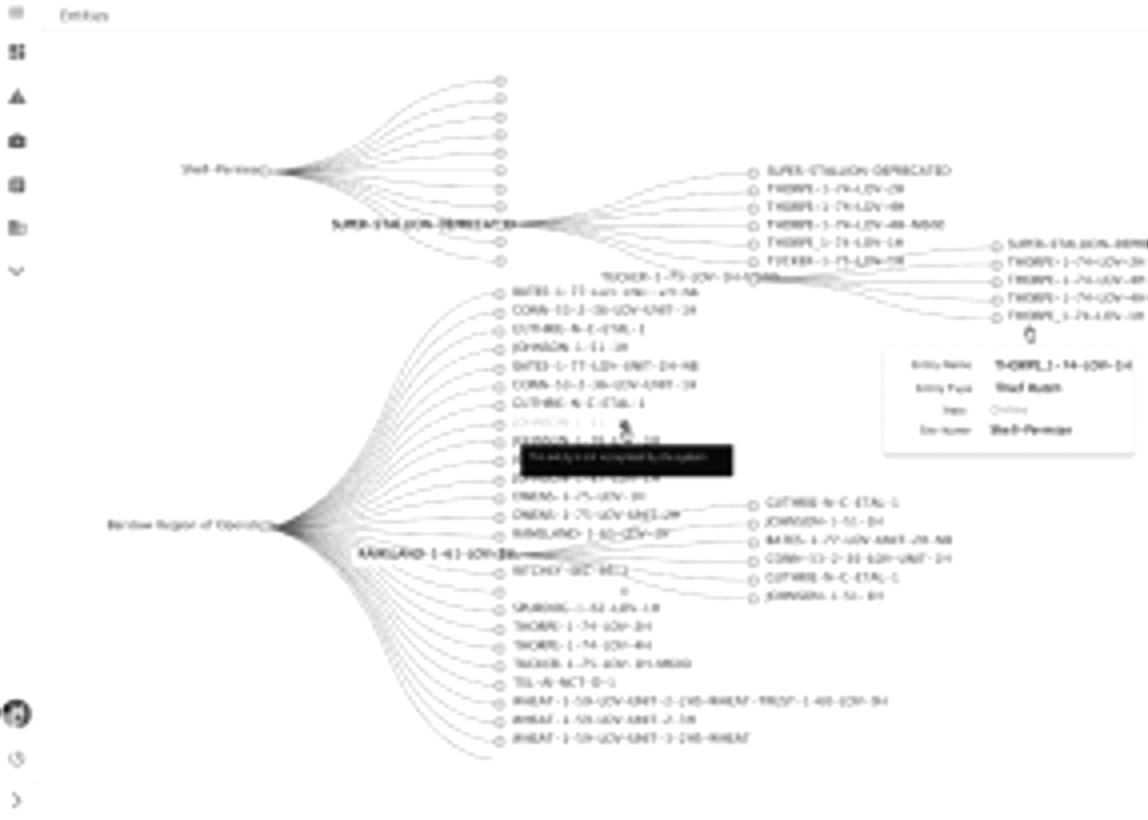
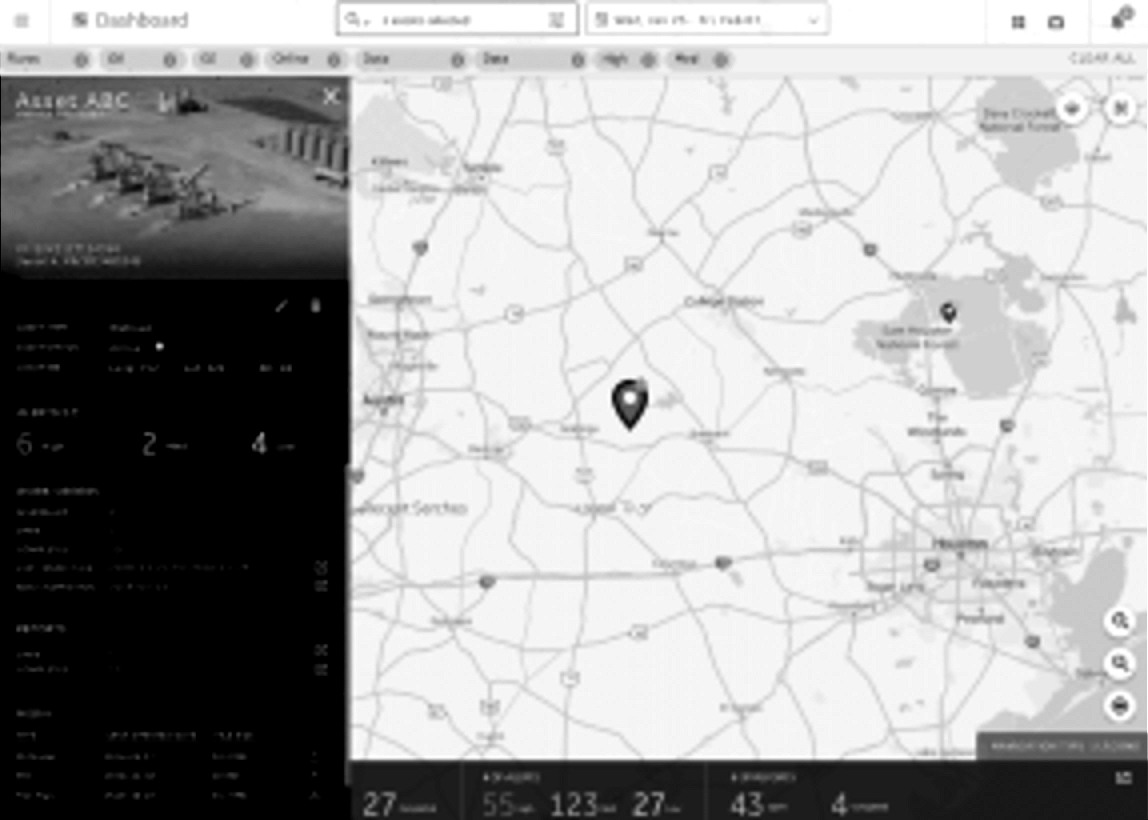
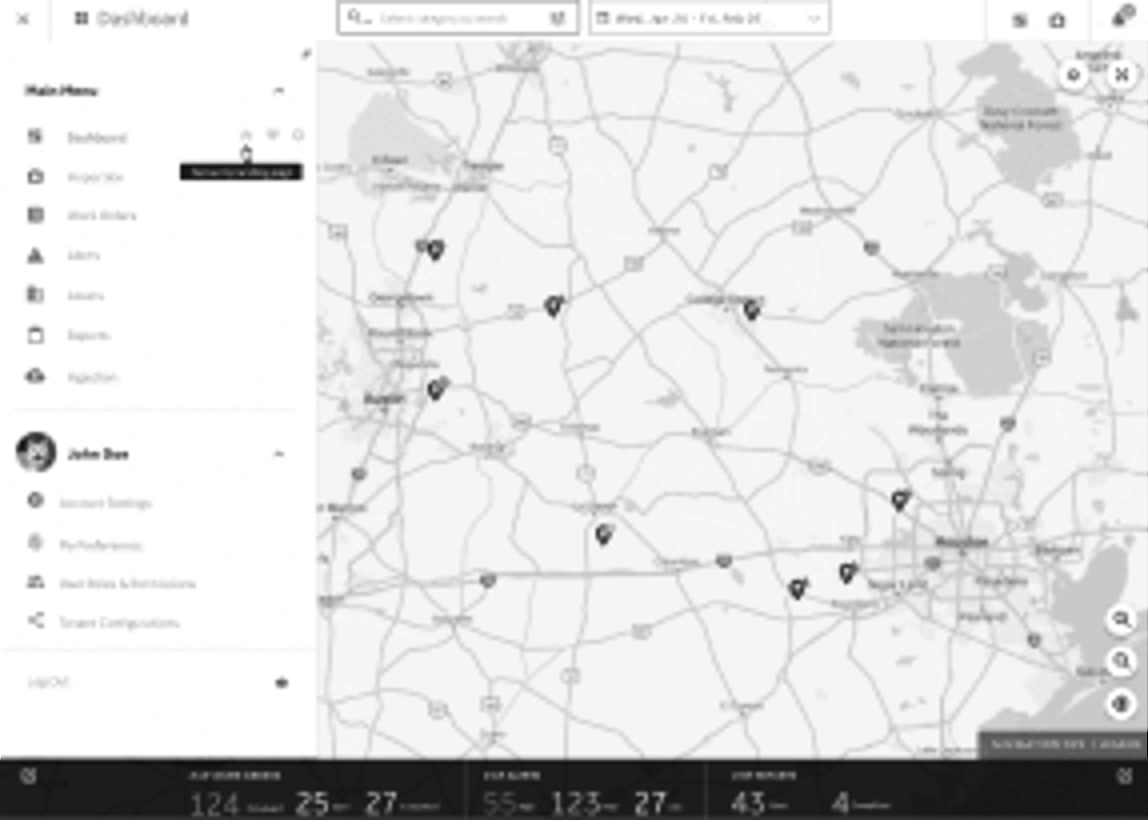
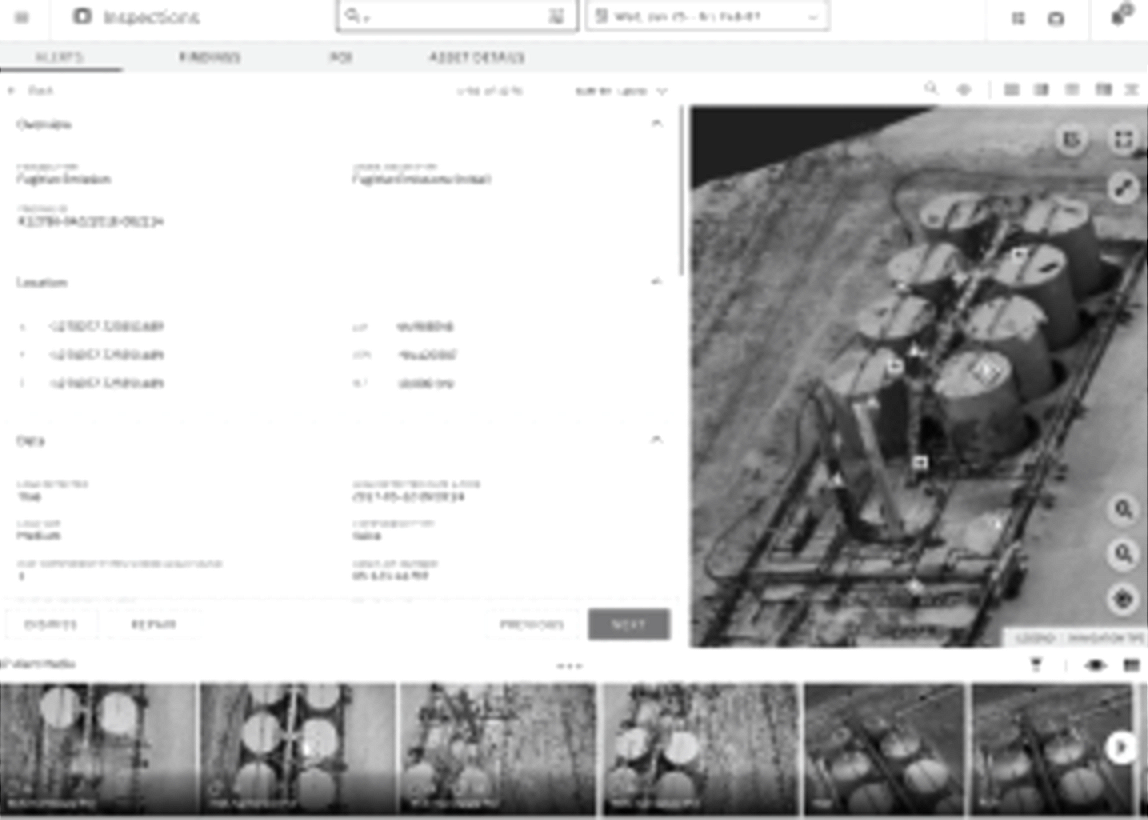
Workshop: Walking the team through concepts
We brought the team together to walk through concepts and test feasibility. Quick feedback loops let us align, secure buy-in, and refine designs on the spot.
Final design
Design components & specification
My design partner and I built a design system and component library.
Prototype
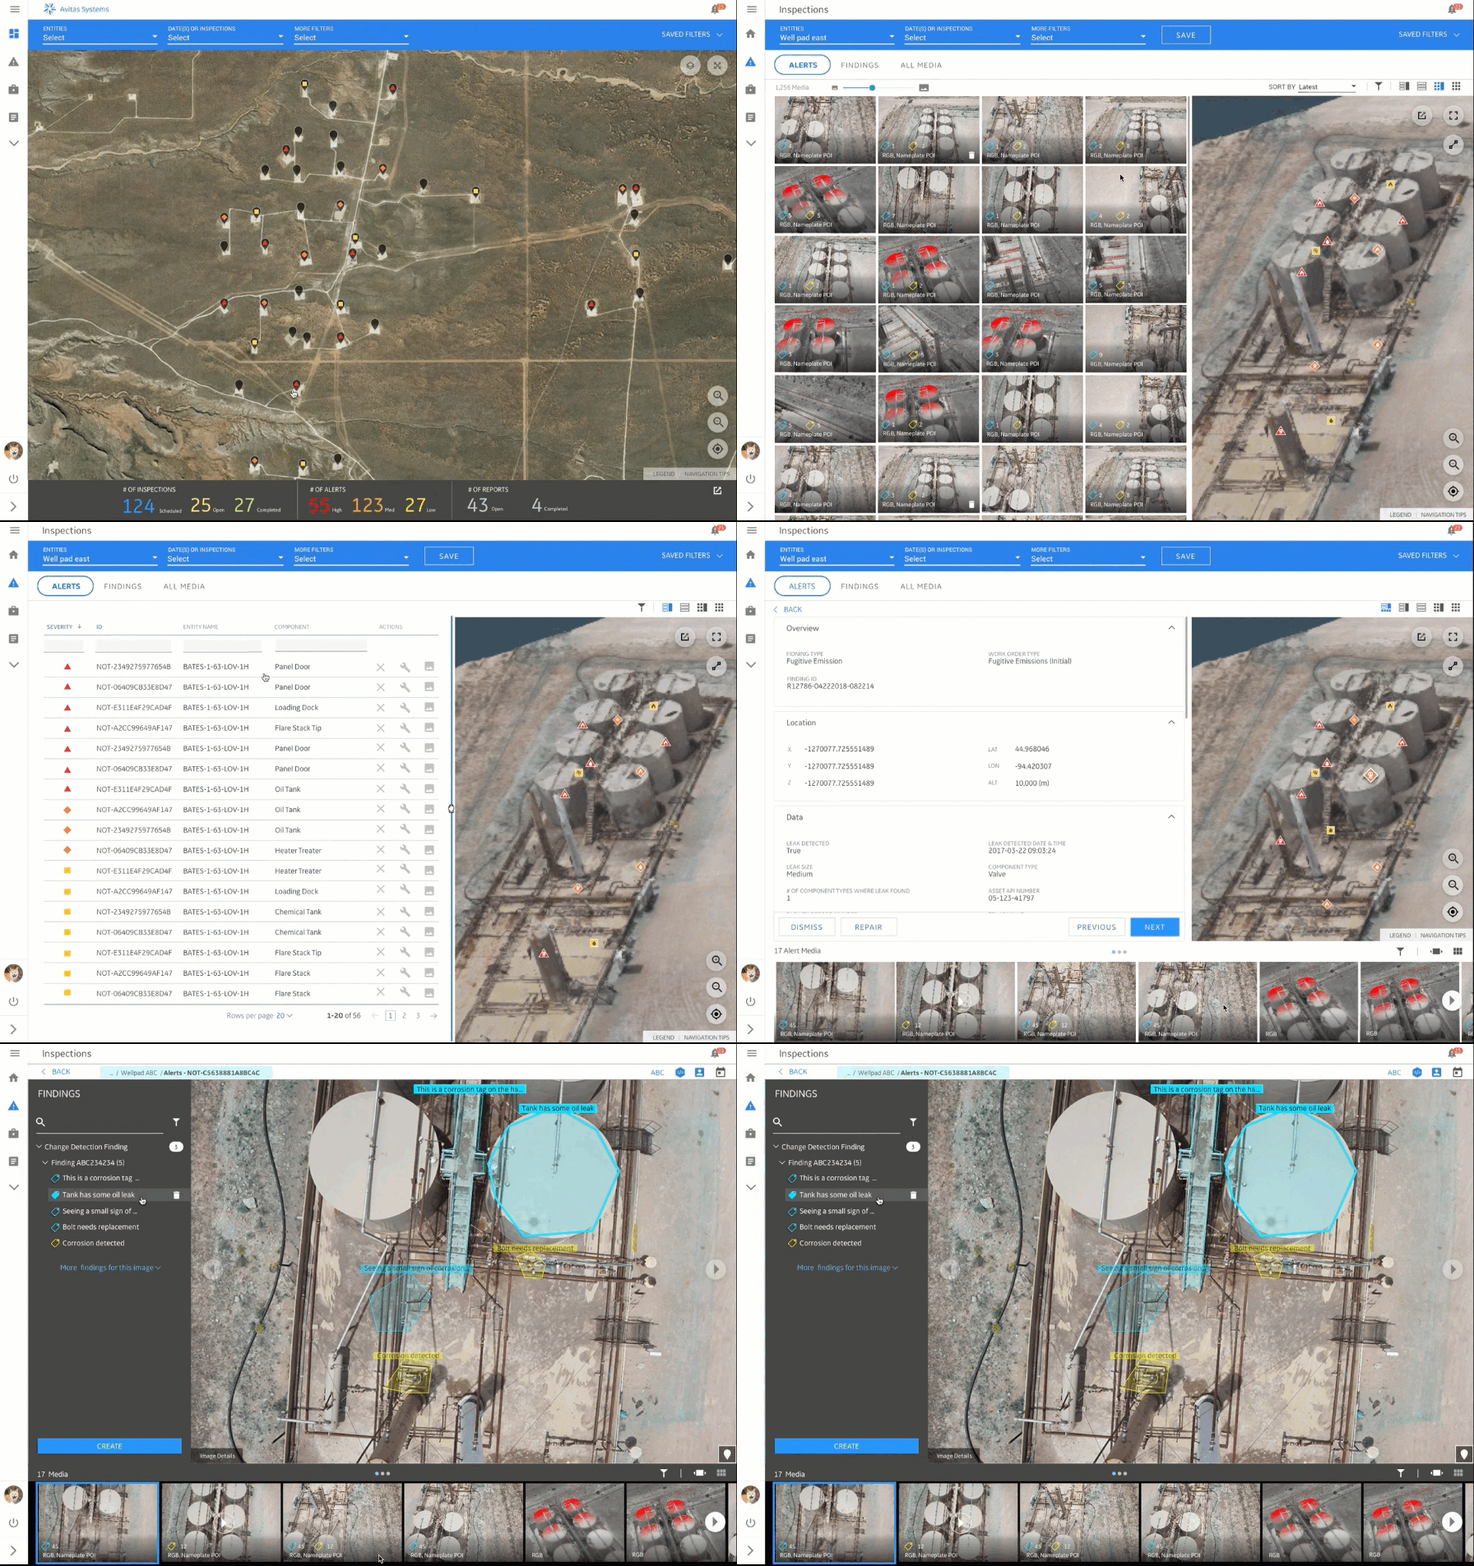
Impact: Transforming the platform with scalable design
The redesigned platform helped inspectors spend more time on actual inspection work and less on searching for information. Unified design across oil & gas, power, and renewable energy created a foundation strong enough to scale, reducing internal effort and letting customers adapt the platform to their unique needs.
Takeaways
Constraints: limited design resources, and a platform built from the ground up.